Picking ties up 40-55% of warehouse costs, yet most calculations only count the direct wage. In this article's worked example, the cost per pick rises from €0.28 to €0.42 once the eight cost blocks above the wage are included. The article breaks them down and shows which process levers bring them back down - up to the point where the structure of the warehouse decides.
Ask what a pick costs, and most warehouses answer with the same calculation: the pickers' annual payroll, divided by the number of picks. The figure is quick to produce, and it is reliably too low, because it contains the direct wage and nothing else - no shift premiums, no temporary labor for the peak, no error costs.
That is too rough an answer for a line item this size. Industry data puts picking at 40-55% of total warehouse costs - no other block in warehouse operations comes close. Before planning any reduction, it pays to run the full calculation first.
What the usual calculation leaves out
Above the direct wage sit eight cost blocks that are rarely counted in one place. Each looks small on its own. Together they push the true cost per pick well above the wage figure - how far depends on shift model, seasonality, and assortment. The ranges in the table are industry and collective-agreement values, not NEO figures.
| Cost block | Typical range |
|---|---|
| Team leads and supervision | 1 team lead per 8-12 pickers, 20-35% above picker wage |
| Shift premiums | Late shift 10-20%, night shift 25-50% |
| Temporary labor in the peak | 20-40% above staff wage |
| Sickness and turnover | Warehouse sickness rate 6-8% |
| Onboarding | 2-4 weeks at 40-70% performance |
| Picking errors and returns | 0.1-0.3% error rate, €10-30 per return |
| Peak overtime | 5-10% of annual hours, at a 25% premium |
| Floor space for picking routes and buffers | €4-8 per m² per month |
Two things make these blocks easy to underestimate. Most of them scale with the wage: when base pay rises, premiums, supervision, and absence costs rise automatically with it. And several of them concentrate in the season - temporary labor, overtime, and part of the onboarding land exactly when the warehouse is already running at its limit. A warehouse with a pronounced peak therefore pays more per pick than one with the same annual volume and a flat curve.
A worked example: from €0.28 to €0.42 per pick
What the blocks add up to shows in the default scenario of our picking cost calculator. It starts from openly stated assumptions: 10,000 picks on a normal day, 16 pickers, €40,000 in gross wage and employer contributions per person per year, 220 working days, two shifts, and a 15% season peak on 40 days. The direct wage works out to €0.28 per pick - and this is how the rest stacks up:
| Cost block | € / pick | Share of All-in cost per pick |
|---|---|---|
| Direct wage including employer contribution | 0.28 |
66,7 %
|
| Team leads and supervision | 0.03 - 0.05 |
7,1 - 11,9
|
| Shift premiums | 0.01 - 0.03 |
2,4 - 7,1 %
|
| Temporary labor in the peak | 0.01 |
2,4 %
|
| Sickness and turnover | 0.01 |
2,4 %
|
| Onboarding | 0.00 - 0.01 |
0 - 2,4 %
|
| Picking errors and returns | 0.01 - 0.09 |
2,4 - 21,4 %
|
| Peak overtime | 0.00 - 0.01 |
0 - 2,4 %
|
| Floor space for picking routes and buffers | 0.00 |
0 %
|
| All-in cost per pick | 0.42 | 100 % |
The all-in cost lands 50% above the wage-only figure. The cross-check holds as well: the inputs imply 78 picks per person per hour, in the middle of the industry range of 60-120. These are model assumptions, not numbers from a quote; with your own figures the result shifts, and each of the eight blocks can be switched off individually in the calculator.
The three blocks to tackle first
Temporary labor in the peak
The 20-40% premium over staff wages is only the visible part. Temporary workers go through the same onboarding as permanent staff - 2-4 weeks at 40-70% performance - and often leave before that investment pays off. In the season, this repeats every year. The warehouse labor shortage sharpens the problem: where the share of temporary labor in the workforce grows, the block grows with it.
Sickness and turnover
Sickness rates in warehouses run at 6-8%, and picking is physically demanding work with correspondingly high churn. Every replacement triggers the onboarding block again. How labor costs develop from here, and what that does to the numbers, is covered in our article on warehouse labor costs.
Picking errors and returns
At an industry error rate of 0.1-0.3%, the block sounds negligible. On 5,000 picks a day, though, that is five to fifteen errors, each carrying €10-30 in return handling. Unlike premiums or supervision, this item never shows up in a payroll figure; it spreads across returns handling, replacement shipping, and customer service, and stays invisible for exactly that reason.
Cutting costs without investment: the process levers
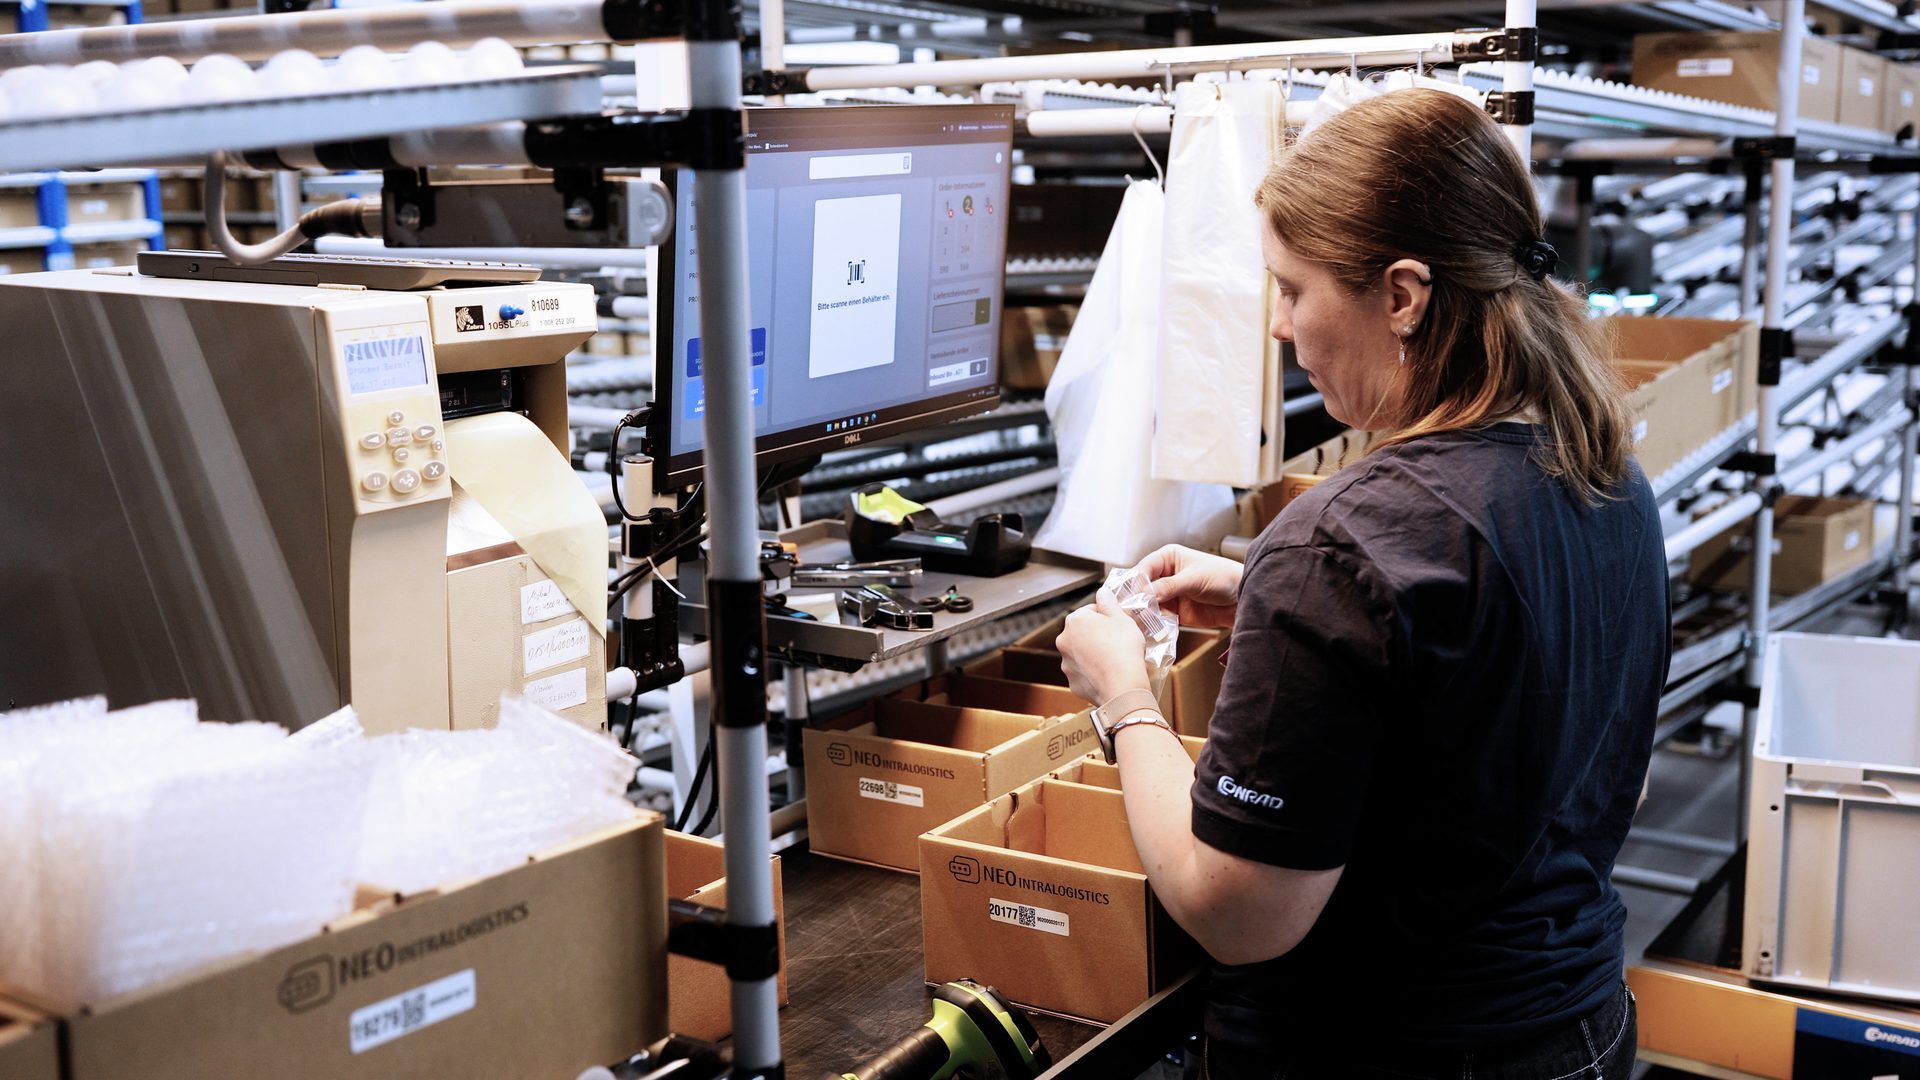
Part of these costs can be cut in the existing operation. The biggest lever is distance: in manual person-to-goods picking, staff walk 10-16 km per shift, and every one of those kilometers is paid time without a pick. Slotting by access frequency, ABC zones near the packing stations, and batch picking with several orders per run shorten the routes without a single machine entering the warehouse.
The second lever is the peak. Smoothing the order load through forecasting and shift planning reduces exactly the blocks that cost the most per hour. The third is onboarding itself: standardized training and pick-by-light or pick-by-display guidance shorten the weeks a new picker spends below normal performance.
For warehouses below roughly 5,000 picks per day, these levers are the recommended path - automation below that line rarely pays for itself. We laid out the criteria in when not to automate your warehouse. So check your volume in the area you would automate before requesting quotes.
Where process optimization hits its limits
The process levers lower the cost per pick, but they do not change the structure: the person still walks to the goods, and every pick carries its share of the distance. Even a well-optimized manual warehouse therefore stays within the industry range of 60-120 picks per person per hour.
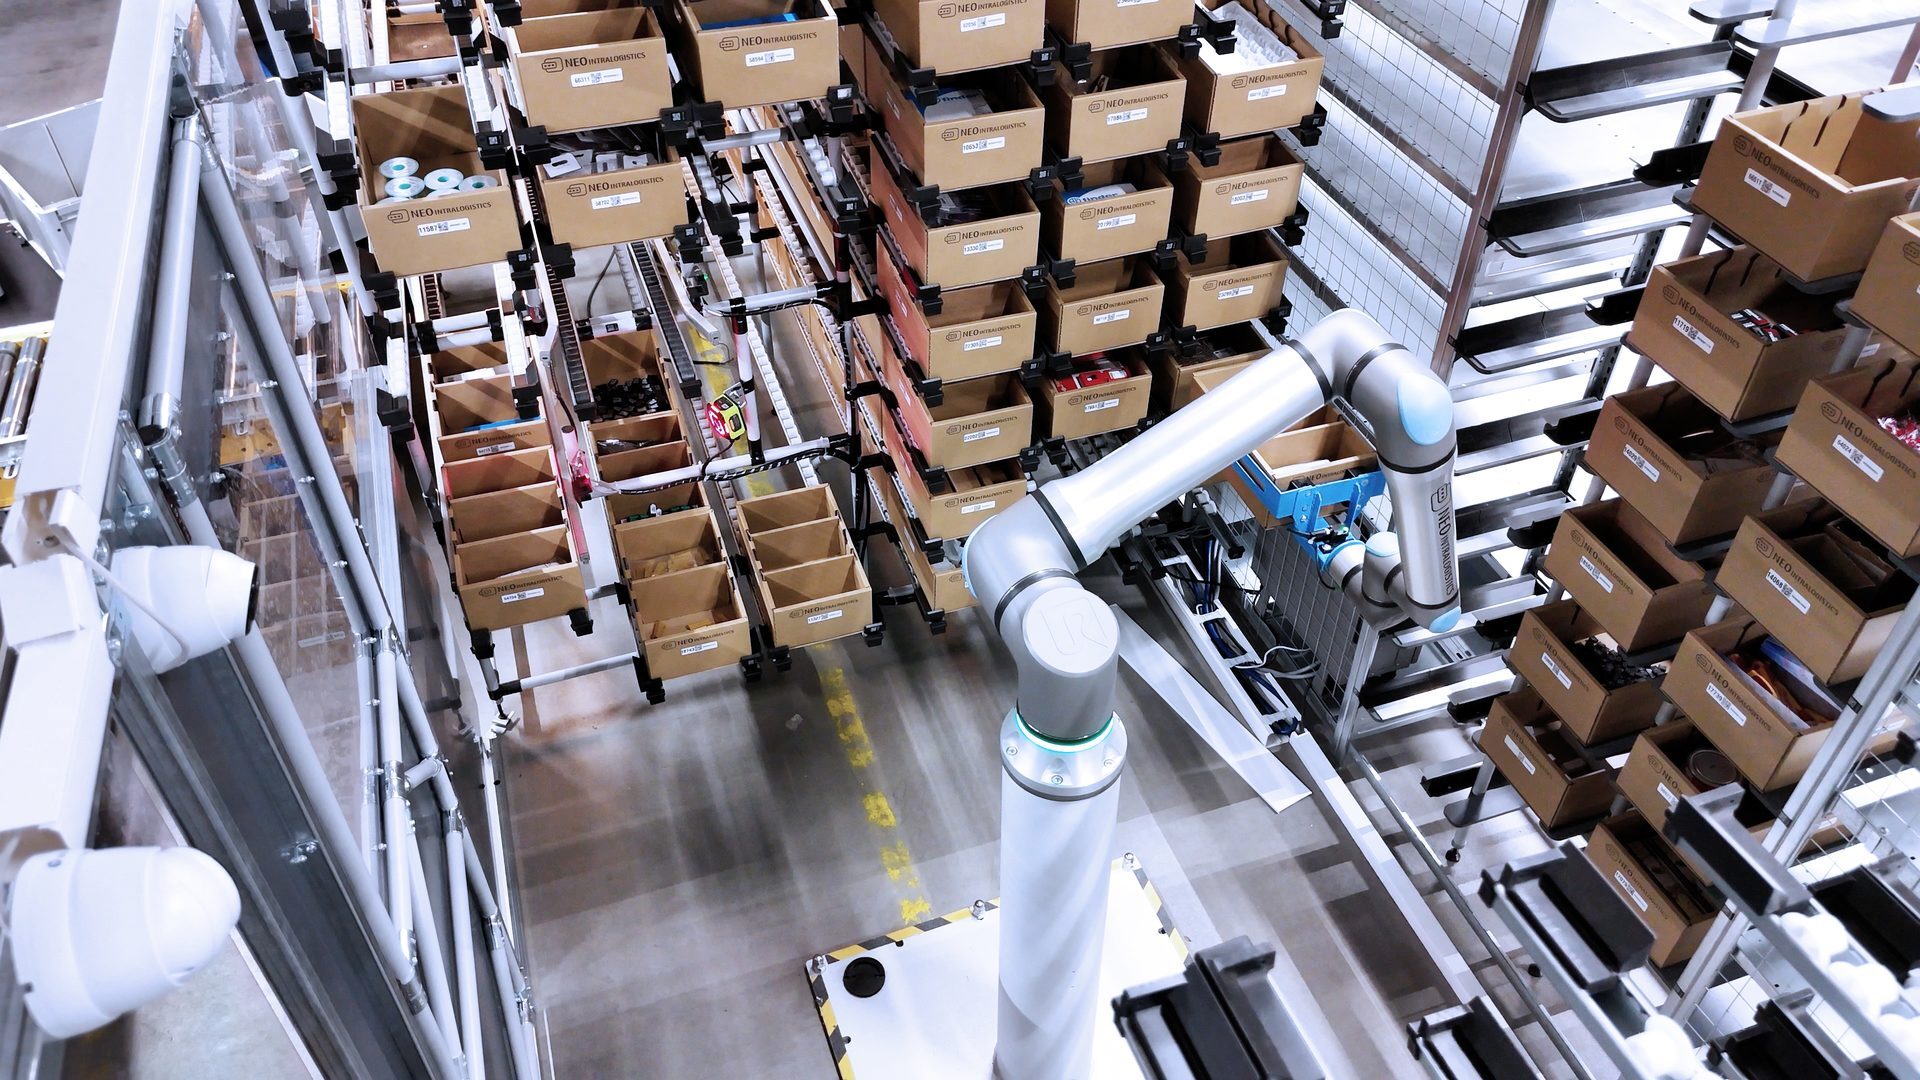
Goods-to-person picking turns the principle around: autonomous mobile robots fetch the bins from the shelf, and the goods come to the person. A NEO:pickstation reaches 350 picks per hour, and the error rate drops below 0.01% with system guidance, which removes most of the returns block. Across all installations, the result is 70% less picking labor in the automated area.
The cost blocks from the table do not disappear - whoever works at a picking station still gets sick, works late shifts, and needs onboarding. They just apply to far fewer people. What the two routes to that point cost - a conventional rebuild versus a retrofit in live operation - is covered in retrofit warehouse automation; the pricing model behind it is described on the pay-per-pick page.
Your own numbers
Which lever pays off for a specific warehouse is not decided by a benchmark table but by your own figure. Our picking cost calculator produces it in a few minutes: all eight cost blocks can be toggled individually, the result appears as a range rather than a single flattering number, and the assumptions are shown right alongside. Your inputs stay in the browser, and the print view is made for passing the result on to procurement or management.
If your warehouse sits above the volume threshold, the next step is seeing the system in operation.